



Early in my career I accepted a transfer from a mid-sized city in Ontario to a branch office in Alberta without checking one number. I assumed that the pay for the same drafting job would be roughly the same everywhere, and that the move was about the work and the lifestyle. Three months later I learned that a colleague with the same experience, in the same firm, was earning noticeably more than I had been in Ontario, and that his rent was lower than mine. Nobody had lied to me. I simply had not asked.
That memory comes back every time a young drafter tells me they are “thinking about moving to Vancouver” or “to Calgary”. The province you work in changes your salary, your cost of living, your employer options and even the rules about what an employer has to tell you in a job ad. Yet most salary discussions use a single national number, which hides all of it.
This guide compares the provinces side by side, for four job families that matter to CAD, BIM and GIS professionals: drafting technologists and technicians, architectural technologists, civil engineering technologists and GIS analysts. It uses official Job Bank data, explains where each province wins and loses, and shows what to check before you decide that a province is “better paid”.
The Short Answer
Looking at the four families together, the provinces fall into three groups:
- Highest pay: Saskatchewan, Alberta and British Columbia. The simple average of their four family medians is about $36 an hour, roughly 7% above the national average of the same four families.
- Middle: Québec, Newfoundland and Labrador, Nova Scotia, Manitoba and Ontario. Averages between about $32 and $33 an hour.
- Lowest: New Brunswick among the nine provinces compared here, at about $31.30, and Prince Edward Island for drafters, where the median is $26.91.
These figures come from the Job Bank release updated on November 19, 2025, which reflects wages paid in 2023–2024. They are medians (the middle wage), not averages of individual salaries. The “average of four medians” is my own simple indicator to show the overall pattern. It is not an official statistic.
Two more things matter more than the ranking itself:
- The ranking changes with the job family. Alberta leads for drafting and GIS, British Columbia for civil, Saskatchewan for architectural. Nobody wins everywhere.
- The gap between provinces is smaller than the gap inside a province. In every family, the difference between the 10th and 90th percentile in a single province is far larger than the difference between provincial medians. Your own scope of work still matters most.
For how Job Bank builds these numbers, see CAD, BIM and Drafting Salaries in Canada: The Complete 2026 Data Guide.
The Full Comparison
| Province | Drafting (22212) | Architectural (22210) | Civil (22300) | GIS analyst (22214) | Average of the four |
|---|---|---|---|---|---|
| Canada | $31.79 | $30.10 | $33.89 | $38.10 | $33.47 |
| Saskatchewan | $35.78 (est.) | $34.66 (est.) | $36.00 | $37.66 | $36.02 |
| Alberta | $36.00 | $31.79 | $33.65 | $42.56 | $36.00 |
| British Columbia | $33.65 | $34.31 | $38.00 | $37.79 (est.) | $35.94 |
| Québec | $29.81 | $29.50 | $33.79 | $38.00 | $32.77 |
| Newfoundland and Labrador | $36.00 | $31.89 (est.) | $29.00 | $33.33 | $32.55 |
| Nova Scotia | $29.85 (est.) | $31.49 (est.) | $33.12 (est.) | $34.55 (est.) | $32.25 |
| Manitoba | $30.03 | $31.34 (est.) | $29.81 | $37.28 | $32.12 |
| Ontario | $31.25 | $28.85 | $32.60 | $35.00 | $31.93 |
| New Brunswick | $30.00 | $32.56 (est.) | $29.57 | $33.12 (est.) | $31.31 |
Median hourly wages. (est.) marks Statistics Canada model-based estimates. “Average of the four” is my own simple indicator, not an official statistic. Prince Edward Island is left out because Job Bank does not publish all four families there.
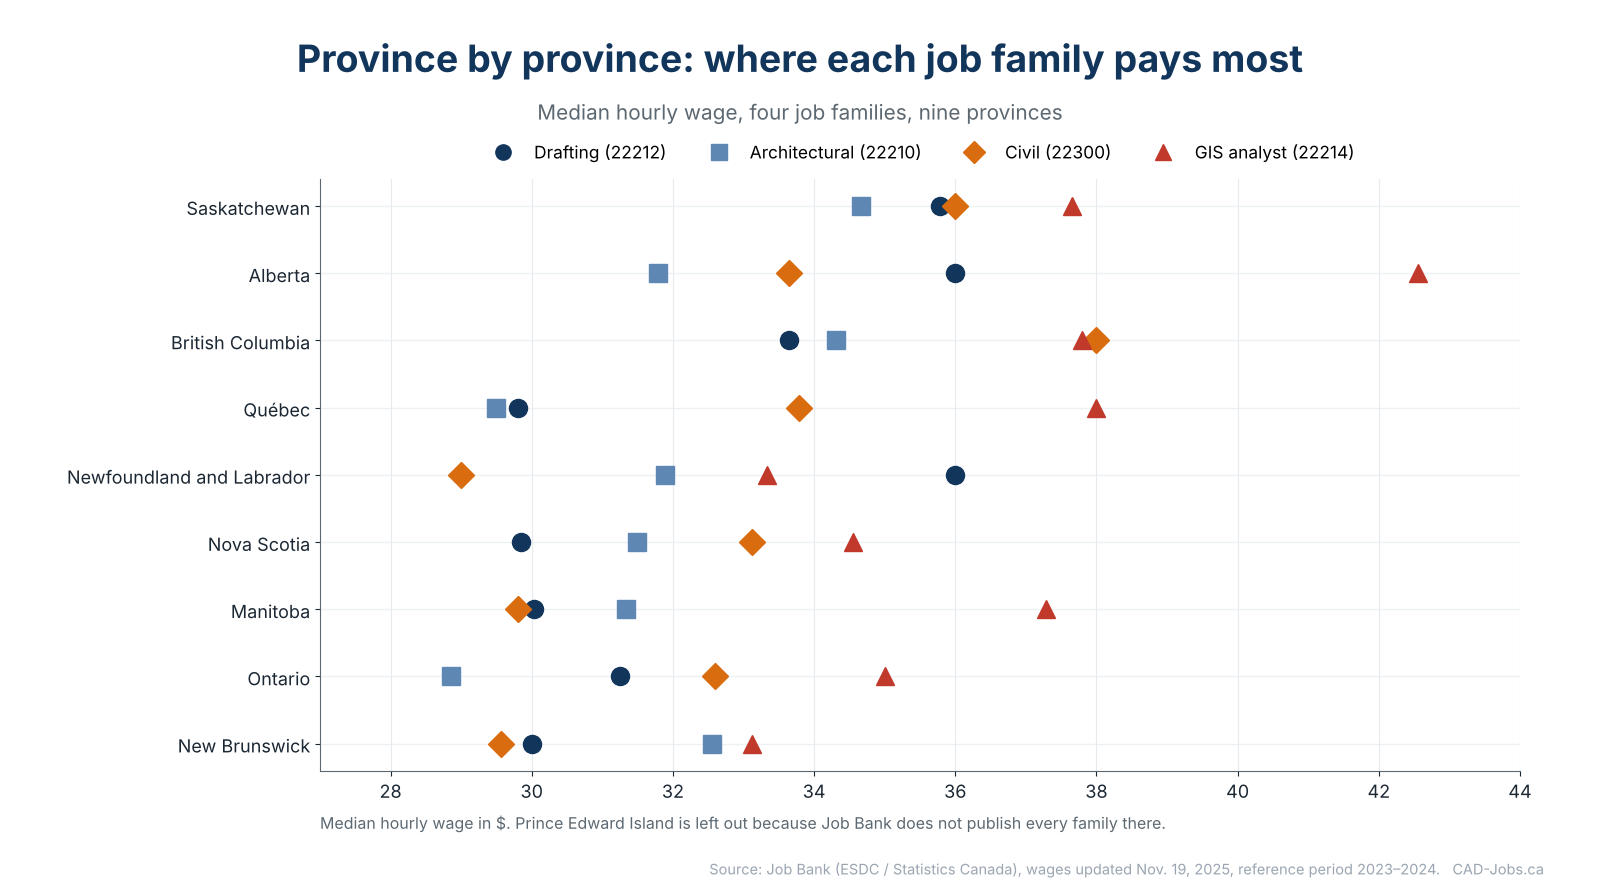
How to read the table:
- Each row is a province, each column a job family. Compare along a row to see which job family pays most in your province, and down a column to see which province pays most for your job.
- The last column averages the four medians so you can see the overall pattern at a glance.
- Marked values (est.) come from Statistics Canada’s model-based Small Area Estimation instead of a direct survey count. They are reliable indicators but not exact measurements.
What Each Province Looks Like
Alberta
Alberta has the highest medians for drafting technologists ($36.00) and GIS analysts ($42.56), and a strong figure for civil technologists ($33.65). The provincial survey agrees with Job Bank: Alberta’s own 2023 Wage and Salary Survey reports an average of $38.24 an hour for drafting technologists and technicians, about $76,000 a year.
What drives it: energy, resource and industrial projects, a large engineering consulting sector in Calgary and Edmonton, and provincial and municipal governments that employ many GIS and design technologists. In Calgary, Job Bank reports about 4,010 people working as drafting technologists and technicians, with 63% of them in professional, scientific and technical services and 9% in construction.
What to watch: the market is cyclical. When oil prices fall, hiring slows quickly. Alberta also has no provincial rule requiring pay information in job ads, so you may need to ask early in the process.
British Columbia
British Columbia is the best-paid province for civil engineering technologists ($38.00) and also strong in architectural ($34.31), drafting ($33.65) and GIS ($37.79). WorkBC reports annual earnings of $64,938 for drafting technologists and technicians and $70,036 for architectural technologists, and forecasts about 1,650 openings for drafting and 740 for architectural technologists between 2025 and 2035.
What drives it: infrastructure, resource and building projects, and a competitive Vancouver labour market.
What to watch: housing costs. I show in CAD Salaries by City: Toronto, Vancouver, Calgary, Montréal and Beyond (With Cost of Living) that rent takes a much larger share of a drafter’s pay in Vancouver than in most other cities. BC does help you in one way: employers must include the expected pay or a range in public job postings, and they cannot ask you about your pay history.
Saskatchewan
Saskatchewan has the highest average of the four families, helped by the top architectural median ($34.66), a strong civil median ($36.00) and GIS ($37.66), plus drafting at $35.78. Several Saskatchewan figures come from Statistics Canada’s model-based estimates, so they deserve a small margin of caution.
What drives it: mining, agriculture, energy and infrastructure, in a small labour market where qualified technologists are hard to find.
What to watch: a smaller number of employers, so your options are fewer if one project ends.
Ontario
Ontario is the largest market, and its medians are around or just below the national figures: drafting $31.25, architectural $28.85 (the lowest of all provinces), civil $32.60 and GIS $35.00. The Toronto Region median for drafters is $32.50, a modest premium over the province.
What drives it: size and competition. Ontario has more drafters, more graduates and more employers than anywhere else, which gives you choice but also keeps medians moderate.
What to watch: since January 1, 2026, Ontario employers with 25 or more employees must include the expected pay or a range in public job postings (the range cannot be wider than $50,000), and postings cannot require Canadian experience. That makes Ontario the easiest large market in which to compare real offers against Job Bank medians.
Québec
Québec’s medians are $29.81 for drafting, $29.50 for architectural, $33.79 for civil and $38.00 for GIS. Québec’s own occupational profile gives a drafting median of $31.00 an hour (averaging 2023 to 2025) and counts about 9,000 people working in the occupation in 2024.
What drives it: a strong engineering and construction sector, public infrastructure programs, aerospace and manufacturing, and the requirement to work in French. Two things set Québec apart: its civil and GIS medians are noticeably higher than its drafting and architectural ones, and architectural technologists must belong to the professional technologists’ order to use the title “Professional Technologist”.
What to watch: Québec has no pay transparency law for job postings, so you will often see a salary only after you ask.
Manitoba
Manitoba is close to the national median for most families: drafting $30.03, architectural $31.34, civil $29.81, GIS $37.28. Its GIS figure is a standout compared with its other families.
New Brunswick and Nova Scotia
Both sit slightly below the national medians for drafting and civil, but architectural is relatively strong in New Brunswick ($32.56). GIS medians are $33.12 (New Brunswick) and $34.55 (Nova Scotia), both model-based estimates. New Brunswick’s pay transparency posting rule took effect on June 12, 2026.
Newfoundland and Labrador
Newfoundland and Labrador is among the best-paid provinces for drafting ($36.00), but its civil median ($29.00) and GIS median ($33.33) are low. This is the clearest example in the table of a province whose ranking depends on the job family.
Prince Edward Island
For drafting technologists, Prince Edward Island has the lowest published median in the country at $26.91. Job Bank does not publish architectural, GIS or other family figures there. PEI has required pay information in public job postings since 2022, so postings are often a good way to see what employers actually offer.
The Territories
Job Bank does not publish drafting or architectural wages for the territories. For civil technologists, the Yukon shows a model-based median of $36.74, and for GIS analysts, the Yukon, the Northwest Territories and Nunavut show $44.46, $49.98 and $41.10 respectively. These are estimates for very small labour markets. They reflect recruitment difficulty and a high cost of living, and should not be compared directly with southern cities.
Where Your Province Wins and Loses
A way to use the table is to check which job family gives your province its best relative position.
| Province | Strongest family (relative to its national median) | Weakest family (relative to its national median) |
|---|---|---|
| Saskatchewan | Architectural (+15.1% vs national) | GIS analyst (-1.2% vs national) |
| Alberta | Drafting (+13.2% vs national) | Civil (-0.7% vs national) |
| British Columbia | Architectural (+14.0% vs national) | GIS analyst (-0.8% vs national) |
| Québec | GIS analyst (-0.3% vs national) | Drafting (-6.2% vs national) |
| Newfoundland and Labrador | Drafting (+13.2% vs national) | Civil (-14.4% vs national) |
| Nova Scotia | Architectural (+4.6% vs national) | GIS analyst (-9.3% vs national) |
| Manitoba | Architectural (+4.1% vs national) | Civil (-12.0% vs national) |
| Ontario | Drafting (-1.7% vs national) | GIS analyst (-8.1% vs national) |
| New Brunswick | Architectural (+8.2% vs national) | GIS analyst (-13.1% vs national) |
Each percentage compares the province’s median for a family with that family’s national median.
This shows something I tell every trainee who is thinking about specializing: the same diploma can pay very differently depending on the family you choose and the province you live in. A civil technologist in British Columbia and a drafting technologist in Prince Edward Island are not in the same market.
Pay Is Not the Whole Comparison
Before you decide that a province is “better paid”, check five other things.
1. Cost of living, especially housing. A province that pays $3 more an hour is no better if your rent takes $800 more a month. I compare rent against pay city by city in CAD Salaries by City: Toronto, Vancouver, Calgary, Montréal and Beyond (With Cost of Living).
2. Taxes and deductions. Provincial income tax rates differ, and Québec runs its own pension plan (QPP) and parental insurance plan. Your take-home pay is not a simple fraction of your gross.
3. Job market depth. Job Bank rates the prospects for these occupations by region, and the answer varies. A strong median is of little use if there are only a handful of employers.
4. Employment standards. Overtime thresholds, vacation minimums and notice periods differ by province. I explain how in How to Evaluate a CAD Job Offer: Salary, Benefits, Overtime and Total Compensation.
5. Transparency. Pay transparency rules differ sharply. As of October 2026, British Columbia, Ontario, Prince Edward Island and New Brunswick require pay information in qualifying public job postings. Nova Scotia bans questions about wage history, and Newfoundland and Labrador has passed a posting law that is not yet in force. Elsewhere, there is no general requirement. This changes how easily you can verify the table above against real offers.
How to Use This Comparison
If you are choosing where to start your career, compare the job family you want, not the national headline. Use the table to see where your family pays most, then check the cost of living.
If you are deciding whether to move, calculate the difference in annual pay at your family’s median, subtract the difference in housing cost and add one-time moving costs. If the gain disappears after rent, it was not a raise.
If you are negotiating, use your own province’s figure for your own job family as an anchor. A national median is a weak argument, because every manager knows their own market. The strongest sentence is the one in my guide How to Negotiate a CAD Salary or Raise in Canada: Data, Scripts and Strategy: “The provincial median for this occupation is X, and here is why my experience places me above it.”
If you are an employer, remember that candidates compare provinces too. See CAD Salary Benchmarks for Employers (2026).
Common Mistakes When Comparing Provinces
- Comparing the national median with your own salary. The national figure hides differences of up to $9 an hour.
- Treating model-based estimates as exact. Small provinces carry more uncertainty.
- Ignoring the job family. The province that pays most for drafting is not the one that pays most for GIS.
- Comparing gross pay without housing. The comparison is meaningless in the most expensive cities.
- Forgetting that medians describe 2023–2024. The market has moved since. Cross-check with current postings.
Frequently Asked Questions
Which province pays CAD drafters the most? In the Job Bank release used here, Alberta and Newfoundland and Labrador, both at $36.00 an hour, followed by Saskatchewan at $35.78.
Which province pays the most overall for CAD, BIM and GIS jobs? Taking the average of four family medians, Saskatchewan, Alberta and British Columbia are close together at the top.
Is Ontario a bad province for CAD salaries? No. Ontario is near the national median for most families, with the biggest market and the most employers. Its architectural median is the lowest among the provinces compared.
Is Québec lower paid than the rest of Canada? For drafting and architectural technologists, yes, slightly. For civil and GIS, Québec is at or above the national median.
Do I need to speak French to work in CAD in Québec? Most employers in Québec work in French. Read Working as a CAD Drafter in Canada as a Newcomer: The Complete Guide for how this affects job search.
Where can I see current pay ranges in job ads? In British Columbia, Ontario (employers with 25+ employees), Prince Edward Island and New Brunswick, many public postings now include them.
Sources
- Job Bank: Design and drafting technologist wages (NOC 22212)
- Job Bank: Architectural technologist wages (NOC 22210)
- Job Bank: Civil engineering technologist wages (NOC 22300)
- Job Bank: Geographic information systems (GIS) analyst wages (NOC 22214)
- Job Bank: How wages are determined
- Alberta ALIS: Drafting technologists and technicians
- WorkBC: Drafting technologists and technicians
- Québec: Drafting technologists and technicians
- Employment Hero: Pay transparency laws in Canada, province-by-province guide (status as of October 12, 2026)
Wages describe 2023–2024. Check the live Job Bank pages and your province’s current rules.
A province is a starting point for a decision, not a verdict. Use the numbers to ask better questions, and then ask them.