



Years ago I helped a young designer decide between two offers: one in Vancouver and one in Edmonton. The Vancouver offer was $4,000 higher. She was delighted and ready to sign. I asked her to do something that took ten minutes: write down the rent of a one-bedroom apartment in each city next to each salary. When she did, the “higher” offer left her with less money at the end of every month, a longer commute and a smaller apartment. She took the Edmonton job and, a few years later, bought her first home there.
That is the problem with city salary comparisons. A number on a job offer is not a standard of living. The same drafting skills, the same software and the same diploma buy very different lives depending on where you work. And most salary pages ignore this completely.
This guide compares CAD, BIM and GIS pay across major Canadian cities and regions, using official wage data, and then puts housing costs next to it, because rent is the largest cost that changes from one city to another. I will also be clear about where the data is thin, because for several cities Job Bank does not publish a separate figure and I refuse to invent one.
The Short Answer
For drafting technologists and technicians (NOC 22212), the median hourly wage in the major metropolitan regions is within a narrow band of about $30 to $36 an hour. The differences between cities are real but small compared with the differences in rent.
When I put rent next to pay, the ranking changes dramatically:
- Cheapest relative to pay: Québec City, Edmonton and Montréal, where a 2-bedroom rent takes roughly a quarter of a median drafter’s gross monthly pay.
- Most expensive relative to pay: Vancouver, where the same rent takes over 40% of gross monthly pay, followed by Toronto and Halifax at around 35% to 36%.
The wage figures come from Job Bank (release updated November 19, 2025, reflecting wages paid in 2023–2024). The rent figures are average 2-bedroom rents for purpose-built apartments from CMHC’s Rental Market Survey of October 2025. Both are described in detail below, with their limits.
What the Wage Data Can and Cannot Do
Job Bank publishes wages by occupation and by region. A region is a Statistics Canada geographic area, which often corresponds to a metropolitan area but not always. For some cities the data is detailed. For others, the sample is too small and the published figure is the provincial one, or nothing.
Three rules guide this article.
- I use the city or region figure only where Job Bank publishes it in the release I could verify.
- Where it does not, I use the provincial median and mark it clearly. The marked cities are Winnipeg, Halifax and Québec City.
- I do not mix releases. Job Bank pages for some regions still show older tables, with different results. I stick to the November 2025 release and to figures I could confirm.
For how Job Bank’s low, median and high wages are built, and why the median is the right number to look at, see CAD, BIM and Drafting Salaries in Canada: The Complete 2026 Data Guide.
Drafter Pay and Rent, City by City
| City | Wage basis (drafting technologists and technicians) | Median hourly | Median per year | Average 2-bedroom rent | Rent as share of gross monthly pay | Gross monthly pay left after rent |
|---|---|---|---|---|---|---|
| Québec City | Québec median (province) | $29.81 | $62,000 | $1,277 | 25% | $3,890 |
| Edmonton | Edmonton Region (median only) | $35.73 | $74,300 | $1,603 | 26% | $4,590 |
| Montréal | Montréal Region | $30.00 | $62,400 | $1,346 | 26% | $3,854 |
| Winnipeg | Manitoba median (province) | $30.03 | $62,500 | $1,571 | 30% | $3,634 |
| Calgary | Calgary Region (median only) | $33.65 | $70,000 | $1,914 | 33% | $3,919 |
| Ottawa | Ottawa Region | $33.10 | $68,800 | $1,926 | 34% | $3,811 |
| Halifax | Nova Scotia median (province, est.) | $29.85 | $62,100 | $1,826 | 35% | $3,348 |
| Toronto | Toronto Region | $32.50 | $67,600 | $2,046 | 36% | $3,587 |
| Vancouver | Lower Mainland–Southwest Region | $32.21 | $67,000 | $2,363 | 42% | $3,220 |
Pay: Job Bank, release updated November 19, 2025. Rent: CMHC Rental Market Survey, October 2025, average rent of purpose-built 2-bedroom apartments (Ottawa: Ontario side). Monthly pay = median hourly × 2,080 ÷ 12, before tax.
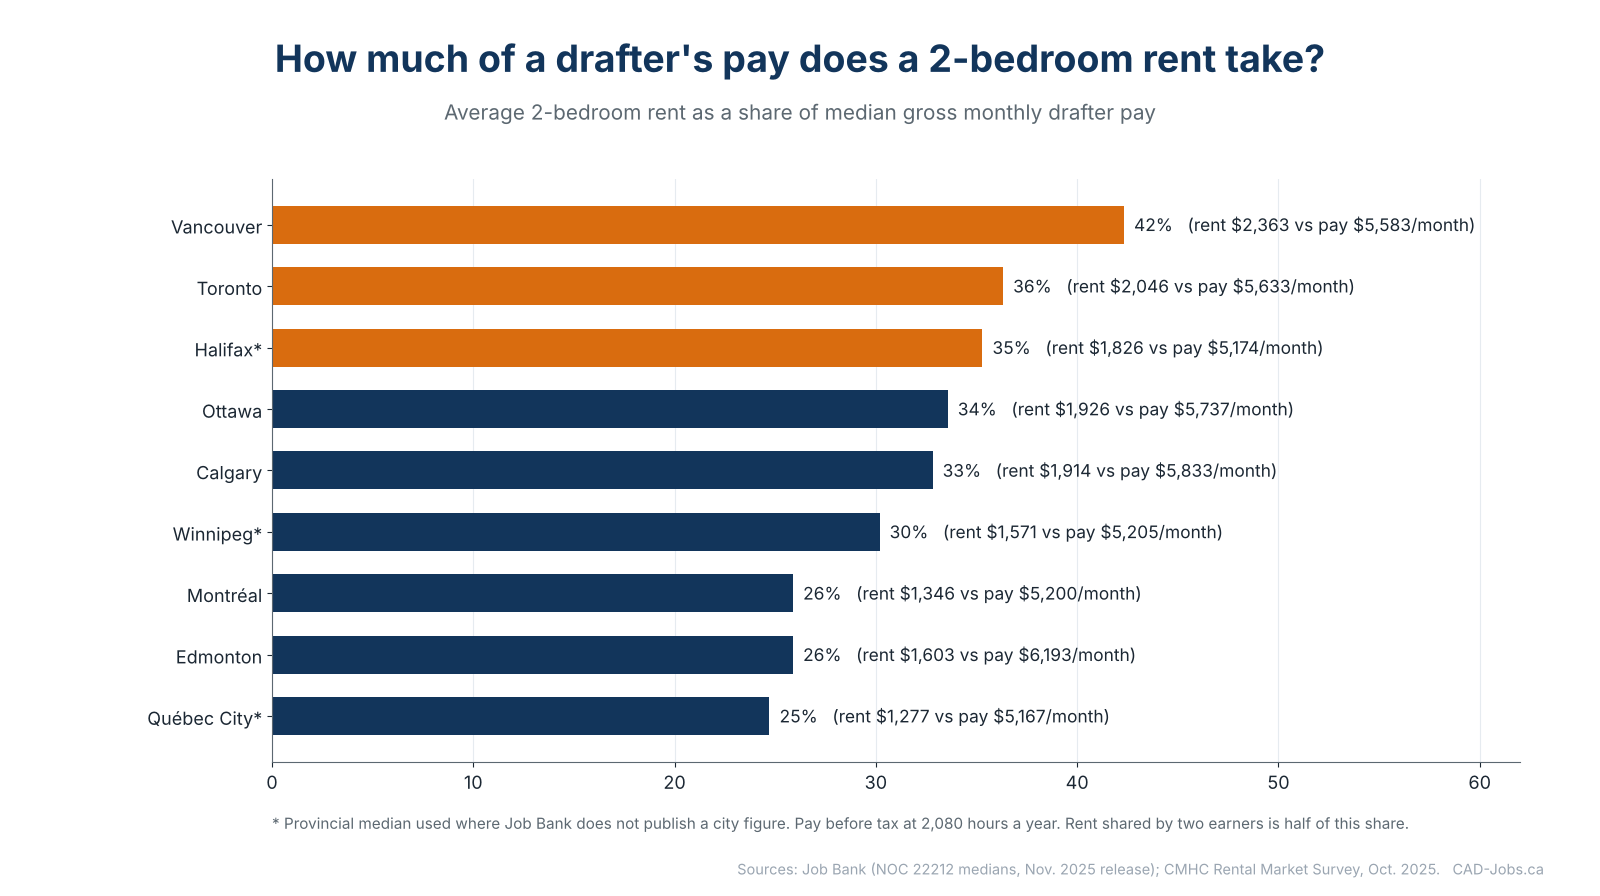
A few notes on how to read this.
- Wage basis. For Toronto, Vancouver (Lower Mainland–Southwest), Ottawa and Montréal, the figures are Job Bank’s regional medians for drafting technologists and technicians. For Calgary and Edmonton, they are the medians shown on Job Bank’s regional summary pages. For Winnipeg, Halifax and Québec City, I use the provincial median because I could not confirm a regional figure for the same release.
- Rent basis. CMHC’s October 2025 survey measures the average rent of purpose-built 2-bedroom apartments, including units occupied by long-term tenants. It does not show what a new tenant pays today. In the same period, average asking rents for new 2-bedroom leases were far higher in some cities: about $3,030 in Vancouver and $2,400 in Halifax, according to a compilation of CMHC and listings data. If you are moving, your real rent may be higher than the table shows.
- Rent share. I divide the average 2-bedroom rent by median gross monthly pay at 2,080 hours a year. This is a rough indicator. It ignores taxes, which differ by province, and assumes one earner. If two people share the rent, the share is half as large.
What the Table Shows
Vancouver has a median wage of $32.21, close to Toronto’s, and the highest rent by far at $2,363 for a 2-bedroom. Rent takes about 42% of a median drafter’s gross monthly pay. This is why many Vancouver-based designers share housing, commute long distances or leave.
Toronto ($32.50) is similar on pay and cheaper than Vancouver on rent ($2,046), but it still takes about 36% of gross monthly pay.
Halifax is a surprise. The provincial median for Nova Scotia is a model-based estimate of $29.85, and Halifax’s average 2-bedroom rent is $1,826, so rent takes about 35% of pay. A smaller city does not automatically mean affordable.
Calgary ($33.65 median, $1,914 rent) and Ottawa ($33.10, $1,926) are in the middle, with rent taking about a third of gross monthly pay.
Edmonton is the best combination in the table: the highest wage ($35.73 median) and one of the lowest rents ($1,603), so rent takes only about a quarter of gross monthly pay. After rent, an Edmonton drafter has roughly $4,600 of gross monthly pay left, against about $3,200 in Vancouver. That difference matches the story I told at the start of this guide.
Montréal and Québec City have the lowest rents ($1,346 and $1,277) and, because wages are also lower, rent takes about a quarter of pay. That is a strong result, but it comes with another condition: working in French.
Other Job Families, City by City
Drafting is not the only job family. Here are the regional medians that Job Bank publishes for architectural, civil, mechanical design and GIS roles, where I could confirm them in the November 2025 release.
| Region | Province | Architectural | Civil | Mechanical design | GIS analyst |
|---|---|---|---|---|---|
| Toronto Region | ON | $30.60 | — | $38.00 | — |
| Ottawa Region | ON | $28.41 | — | $36.82 | — |
| Hamilton–Niagara Peninsula | ON | $28.85 | — | $38.82 | — |
| Edmonton Region | AB | $32.25 | — | $40.45 | — |
| Red Deer Region | AB | — | — | $41.31 | — |
| Lethbridge–Medicine Hat Region | AB | — | — | $38.36 | — |
| Wood Buffalo–Cold Lake Region | AB | — | — | — | $43.78 |
| Lower Mainland–Southwest (Vancouver) | BC | — | $38.00 | — | $39.27 |
| Vancouver Island and Coast | BC | — | $40.13 | $40.79 | $38.63 |
| Saskatoon–Biggar Region | SK | $38.45 | — | $42.33 | — |
| Montréal Region | QC | $30.34 | $33.79 | $35.00 | — |
| Moncton–Richibucto Region | NB | $33.54 | $29.57 | $32.72 | — |
Median hourly wages, Job Bank release updated November 19, 2025. A dash means I could not confirm a regional figure in that release. Several regional figures are model-based estimates.
What stands out:
- Mechanical design pays more in industrial regions. Saskatoon–Biggar ($42.33) and Edmonton ($40.45) are well above Toronto ($38.00) and Montréal ($35.00).
- Civil technologists in coastal British Columbia are highly paid, with $40.13 on Vancouver Island and the Coast and $38.00 in the Lower Mainland.
- Architectural technologists in Saskatoon ($38.45) and Edmonton ($32.25) are paid more than in Toronto ($30.60) or Ottawa ($28.41).
- GIS analysts in Wood Buffalo–Cold Lake ($43.78) earn more than in any other region I verified, an example of how a resource economy lifts specialized roles.
The City-by-City Picture
Here is a short portrait of each major market, combining the data above with what I have seen managing teams.
Toronto
The biggest CAD, BIM and GIS market in the country. Large consulting firms, municipalities, utilities and a deep pool of contractors. Pay is about the Ontario median plus a small premium, and housing costs are high. The advantage is choice: you can change employers without changing cities, and since January 1, 2026, Ontario employers with 25 or more employees must include pay information in public postings.
Vancouver
The strongest civil and infrastructure region, with well-paid civil technologists and GIS analysts. The weakness is housing. If you are moving to Vancouver, plan for the rent in the table and treat the median wage as a starting point only.
Calgary
A large engineering and energy hub. Job Bank reports about 4,010 people working in drafting technology in the Calgary region, mostly in professional, scientific and technical services (63%) and construction (9%), and it rates the outlook for 2025 to 2027 as moderate. The wage level is attractive, and housing is much more manageable than in Vancouver or Toronto. The risk is cyclicality.
Edmonton
The best pay-to-rent ratio of the cities I compare. Strong in mechanical design, industrial and government work. Less visible than Calgary in the national discussion, which is exactly why it is often a good place to work.
Montréal
A major engineering, aerospace, transit and construction market with the lowest rents among the large cities. The condition is French: the working language of most employers is French. See Working as a CAD Drafter in Canada as a Newcomer: The Complete Guide for the practical consequences.
Ottawa
A city of federal government, public works, telecommunications and technology employers. Pay is above the Ontario median, and housing is lower than in Toronto. Government roles bring stability and pensions.
Québec City
The lowest rent in this comparison and a strong public-sector and engineering base. The pay for drafters follows the Québec median, so the advantage is mostly in the cost of living.
Winnipeg
A solid mid-sized market with moderate rent ($1,571). I used Manitoba’s provincial median, $30.03, because I could not confirm a regional figure for the same release. Job Bank has described the local outlook for drafting as limited in some earlier releases, so check the current page.
Halifax
A growing market, especially for engineering, defence and shipbuilding-related work. The provincial median is modest, and rent has risen quickly, so the ratio is less favourable than people expect.
How to Compare Two Cities in 15 Minutes
I teach this method to every designer facing a relocation.
- Find the median for your job family in each city or province. Use Job Bank, and note whether the figure is for the city or the province.
- Convert to monthly gross pay. Median hourly wage × 2,080 ÷ 12.
- Estimate housing. Use CMHC’s average rent for the city, then check current asking rents because new tenants pay more.
- Subtract. Monthly gross pay minus housing. This is your “room to live” before taxes, transport, food and savings.
- Add the hidden costs. Commuting, parking, childcare, moving costs, higher provincial taxes.
- Ask what is not in the table. Employer quality, project pipeline, career path and the language you will work in.
- Decide with a range, not a number. If a city only wins by a small margin, choose the one with the better career opportunities.
If you want to run this comparison for your own situation, the CAD Salary Calculator by Role and Province is the right tool. For the province-level view, read CAD Salaries by Province: Ontario, Québec, BC, Alberta and More Compared.
Common Mistakes When Comparing Cities
- Comparing salaries without rent. The most common mistake, and the most expensive.
- Using today’s asking rent and last year’s average rent in the same comparison. Use the same basis for all cities.
- Assuming a smaller city means cheaper. Halifax is the counterexample.
- Ignoring commute and transport. A cheap apartment far from work is a hidden cost.
- Treating one number as exact. Regional wages are based on small samples, and several are model-based estimates.
- Moving for the median. Move for the job and the career path. The median is only the average of everyone else’s choices.
Frequently Asked Questions
Which Canadian city pays CAD drafters the most? Among the cities in this guide, Edmonton has the highest median at $35.73 an hour, followed by Calgary at $33.65 and Ottawa at $33.10. Edmonton and Calgary are median figures from Job Bank’s regional summary pages.
Is it worth moving to Vancouver for a CAD job? Only if the specific job and career path justify the housing cost. Median drafting pay is similar to Toronto’s, but rent is much higher. Civil and GIS roles in the region pay well, so compare the offer for your own family.
What is the cheapest large city for CAD professionals? Québec City and Montréal have the lowest rents among the cities compared, and Edmonton has the best combination of pay and rent in English Canada.
How do I find the exact wage for my city? Search Job Bank for your occupation and city. If the page shows the provincial figure or “n/a”, the sample is too small to publish a regional wage.
Does the wage include benefits? No. Job Bank wages exclude non-wage benefits. See How to Evaluate a CAD Job Offer: Salary, Benefits, Overtime and Total Compensation.
Do cities differ more for GIS or for drafting? For GIS, the spread is larger, because resource regions such as Wood Buffalo–Cold Lake pay much more than other places.
Sources
- Job Bank: Design and drafting technologist wages (NOC 22212)
- Job Bank: Architectural technologist wages (NOC 22210)
- Job Bank: Civil engineering technologist wages (NOC 22300)
- Job Bank: Mechanical engineering design technologist wages (NOC 22301)
- Job Bank: Geographic information systems (GIS) analyst wages (NOC 22214)
- Job Bank: How wages are determined
- CMHC: Rental Market Reports, major centres
- CMHC: 2026 Mid-Year Rental Market Update
Rent figures are averages for purpose-built 2-bedroom apartments from CMHC’s October 2025 survey, as compiled by public rent summaries of the CMHC tables. Verify current figures on CMHC’s site before making a decision.
The right city is the one where the job, the rent and the life you want all line up. The table shows you two of the three.