



The first time I had to put a number on a job offer for a CAD technician, I was a young team leader with a spreadsheet, a nervous HR coordinator and a candidate who was clearly better than the budget I had been given. I got it wrong. I offered too little, lost the candidate to a competitor within a week, and spent the next four months doing his drawings myself at night. That mistake taught me more about salaries than any survey ever did.
Thirty years later, after running CAD departments in large engineering offices, approving hundreds of offers and teaching Autodesk software to people at every level, I still get the same question from trainees, from young designers and from experienced drafters who feel stuck: “Am I being paid fairly?” This guide is my best answer for Canada, built on official data instead of guesses.
I wrote it for four kinds of readers: people choosing a CAD, BIM or GIS career, drafters and technicians preparing for a salary conversation, career changers who want to know what they are walking into, and managers who need a fair offer. Whichever you are, the method is the same: start from solid data, understand its limits, then adjust for your own situation.
What This Guide Is (and What It Is Not)
Most salary pages you find online are averages scraped from job ads and self-reported profiles, often mixing hourly rates, annual salaries, contract rates and US dollars. They look precise and they are not.
This guide is built on three kinds of sources that I trust more:
- Job Bank wage data from Employment and Social Development Canada, produced with Statistics Canada methods. This is the national backbone of every table below.
- Provincial sources that publish their own surveys and profiles: Alberta’s Wage and Salary Survey, WorkBC and Québec’s occupational profiles.
- My own field experience, clearly marked as experience and not as data, because some things that matter in a real negotiation (how salary bands work, what a hiring manager is allowed to offer) are not in any government table.
One date matters. The tables come from the Job Bank release updated on November 19, 2025, which reflects wages paid mainly in 2023 and 2024. Job Bank refreshes its wages once a year, usually in the fall, so I revise this guide each time a new release appears. Always read the figures as “what the market paid recently”, not “what a job posting will say tomorrow”.
The Short Answer: What the Market Pays
Here is the national picture for the job families that matter to CAD, BIM and GIS professionals. “Low” and “high” are roughly the 10th and 90th percentiles, so the middle 80% of workers in each group earn between them.
| Job family | Low (10th pct) | Median | High (90th pct) | Median per year |
|---|---|---|---|---|
| GIS analysts (NOC 22214) | $23.08 | $38.10 | $53.85 | $79,200 |
| Mechanical engineering design technologists (NOC 22301) | $23.08 | $35.00 | $51.28 | $72,800 |
| Civil engineering technologists (NOC 22300) | $22.00 | $33.89 | $51.10 | $70,500 |
| Drafting technologists and technicians (NOC 22212) | $21.50 | $31.79 | $48.38 | $66,100 |
| BIM specialists (title inside NOC 22212, December 2024 release) | $21.00 | $30.29 | $45.00 | $63,000 |
| Architectural technologists (NOC 22210) | $21.00 | $30.10 | $50.68 | $62,600 |
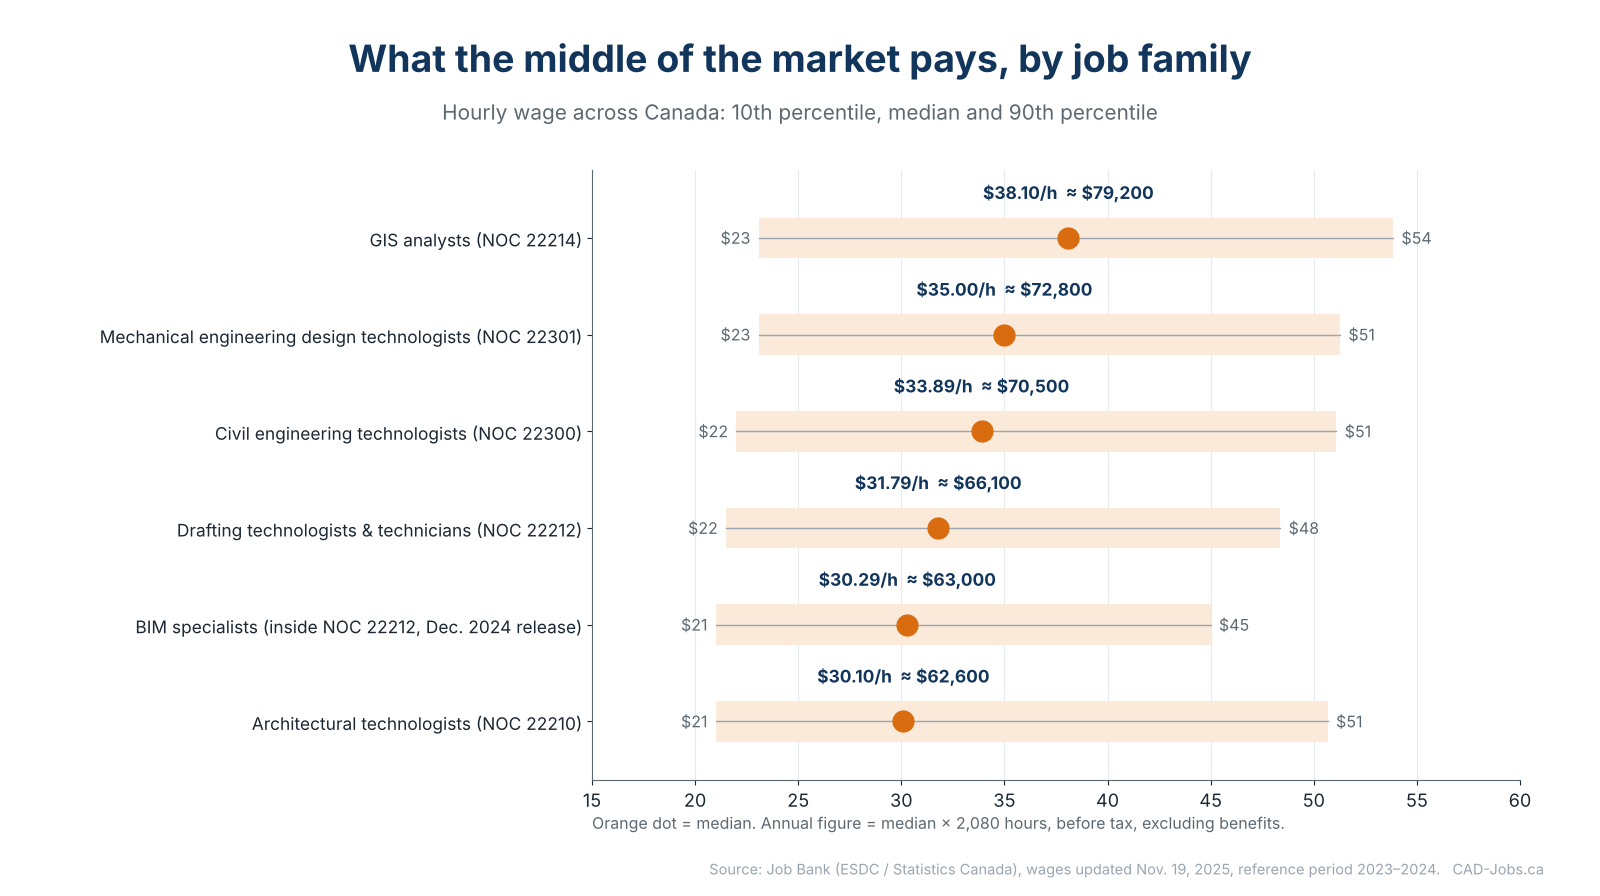
Three things stand out when I look at this table with a manager’s eye.
First, the entry point is not low. The 10th percentile sits around $21 to $23 an hour across the board. Even people at the bottom of these groups, including juniors, part-timers and workers in lower-wage regions, are earning roughly $44,000 to $48,000 a year at full-time hours.
Second, the middle is stable. The medians of the technologist families sit within about $8 an hour of each other, from $30.10 to $38.10. Changing family matters, but it is not a revolution.
Third, and this is the part people miss, the spread inside a single job is far wider than the gap between jobs. For drafting technologists and technicians, the distance between the 10th and the 90th percentile is almost $27 an hour. The distance between the lowest and highest family median is $8. In other words, where you land inside your own range matters more than which job title you choose. Most of this guide is about what moves you within that range.
Where These Numbers Come From, and What They Really Mean
I want you to understand the data well enough to challenge it, so here is how Job Bank builds these figures.
- Median, not average. The median is the middle wage when all wages are ranked. It is less distorted by a few very high or very low earners than an average would be.
- Low and high. In most cases the low wage is the 10th percentile and the high wage is the 90th percentile. If the low is $21.50, then 10% of workers in that group earn $21.50 an hour or less.
- Source. The primary source is Statistics Canada’s Labour Force Survey, with other sources used when the survey sample is too small. Where you see “Small Area Estimation” behind a figure, the number comes from a Statistics Canada statistical model, not a direct count. That applies to several provinces in the tables below.
- Two years of data. To protect quality, wages use two calendar years, which is why these figures describe 2023–2024.
- What is included. Wages are before tax and include tips and commissions, but do not include non-wage benefits such as pensions or health plans.
- What is not adjusted. Job Bank wages do not account for years of experience. The low figure gives a rough hint about entry-level pay, but it is not an “offer for a graduate”.
- Prevailing wages, not offered wages. Job Bank publishes what employees are paid, not what job ads promise.
How I annualize. Job Bank publishes hourly wages for these occupations. To give you yearly figures, I multiply by 2,080 hours (40 hours × 52 weeks) and round to the nearest $100. Many drafters work 37.5 to 40 hours a week, so treat these as comparison figures, not payroll figures. WorkBC, for comparison, calculates annual earnings using the usual hours reported for each occupation, and shows $64,938 a year for drafting technologists and technicians in British Columbia and $70,036 for architectural technologists.
Six Rules for Reading Any Salary Table
Over the years I have watched smart people misuse good data. These six rules prevent most of the damage.
- Read the median first, then the spread. A median of $31.79 with a range of $21.50 to $48.38 tells a very different story from a median of $31.79 with a range of $29 to $35.
- Do not treat the low number as your starting salary. It is the 10th percentile of everyone, including part-timers, people early in their career and workers in low-wage regions.
- Compare like with like. Use the same occupation group and the same province. A national figure hides differences of $9 an hour between provinces.
- Remember the date. These wages describe 2023–2024. I do not add a blanket inflation percentage, because that would be inventing precision. Instead, I cross-check with recent job postings, which now often show pay ranges (see below).
- A title is not an occupation. “CAD technician” at one firm is “designer” at another and “drafting technologist” at a third. Government data groups them under one code, so match yourself by what you actually do, not by what your business card says.
- Hourly and salaried are not enemies. A salaried drafter paid $65,000 and an hourly drafter at $31.25 earn the same on paper. The difference is how overtime, paid breaks and unpaid time are handled.
A useful second source: job postings with pay ranges. Four Canadian jurisdictions required pay information in public job postings as of the autumn of 2026: British Columbia (since November 2023), Prince Edward Island (since June 2022), Ontario (since January 1, 2026, for employers with 25 or more employees, with a range that can be no wider than $50,000) and New Brunswick. Rules change and have exceptions, so check the current text of the law for your province, but the practical result is simple: in those provinces you can now compare Job Bank medians with real posted ranges. When the two agree, trust the number. When they diverge, ask why.
Pay by Job Family: A Guided Tour
Here is a short overview of each family, with a link to the detailed guide.
Drafters and CAD technicians
This is the largest group and the one most people mean when they say “CAD job”. Job Bank classifies drafters, CAD technicians and design technologists under NOC 22212, Drafting technologists and technicians. The national median is $31.79 an hour, about $66,100 a year. Full details, province by province, are in CAD Drafter Salary in Canada (2026): By Province, Experience and Industry, and the career-stage view is in CAD Technician and Drafting Technologist Salary in Canada: Full Breakdown.
Architectural, civil and structural drafters
These disciplines sit in neighbouring codes: architectural technologists (NOC 22210), civil engineering technologists (NOC 22300), and structural drafters and steel detailers, who are generally counted inside the drafting group. Civil technologists have the highest national median among the three, $33.89. I compare them in Architectural, Civil and Structural Drafter Salaries in Canada.
Mechanical designers and SolidWorks users
Mechanical design technologists (NOC 22301) have a national median of $35.00 an hour, and the gap to mechanical engineers is large and consistent. You will find the numbers and my advice on how to position yourself in Mechanical Designer and SolidWorks Salaries in Canada.
BIM modelers, coordinators and managers
BIM does not have its own national occupation code. Job Bank lists BIM technician and BIM specialist as job titles inside the drafting group. Managers and coordinators are paid for their scope of responsibility, not for a software name. I explain how to read this unusual situation in BIM Coordinator, Modeler and Manager Salaries in Canada.
GIS technicians and analysts
GIS roles sit in NOC 22214 (technical occupations in geomatics and meteorology). The national median for GIS analysts is $38.10 an hour, the highest in this guide. See GIS Technician and GIS Analyst Salaries in Canada.
The Provincial Picture
Where you live changes the number more than most people expect. Here is the full province-by-province table for drafting technologists and technicians (NOC 22212), the group most readers belong to.
| Province | Low (10th pct) | Median | High (90th pct) | Median per year |
|---|---|---|---|---|
| Canada | $21.50 | $31.79 | $48.38 | $66,100 |
| Alberta | $25.48 | $36.00 | $53.85 | $74,900 |
| Newfoundland and Labrador | $25.00 | $36.00 | $56.73 | $74,900 |
| Saskatchewan (est.) | $23.47 | $35.78 | $48.98 | $74,400 |
| British Columbia | $20.00 | $33.65 | $51.00 | $70,000 |
| Ontario | $20.00 | $31.25 | $48.08 | $65,000 |
| Manitoba | $22.00 | $30.03 | $48.56 | $62,500 |
| New Brunswick | $23.32 | $30.00 | $40.11 | $62,400 |
| Nova Scotia (est.) | $19.63 | $29.85 | $45.01 | $62,100 |
| Québec | $21.00 | $29.81 | $42.31 | $62,000 |
| Prince Edward Island (est.) | $20.61 | $26.91 | $35.01 | $56,000 |
(est.) marks figures that come from Statistics Canada’s model-based Small Area Estimation instead of a direct survey count. Annual figures: median × 2,080 hours, rounded to the nearest $100.
A few observations from this table:
- Alberta, Saskatchewan and Newfoundland and Labrador pay the most, with medians at or near $36 an hour. Resource-driven economies and tight local labour markets explain much of it.
- Prince Edward Island is the lowest, at $26.91, almost $9 an hour below Alberta. Several Atlantic and Prairie figures come from Statistics Canada’s model-based estimates, so treat them as indicators, not exact measurements.
- Ontario and Québec sit near or just below the national median, at $31.25 and $29.81. They also contain the biggest numbers of jobs, so competition for good roles is higher.
- British Columbia is above the national median at $33.65, but BC also has among the highest living costs, which I cover in CAD Salaries by City: Toronto, Vancouver, Calgary, Montréal and Beyond (With Cost of Living).
Independent sources point in the same direction. Alberta’s own 2023 Wage and Salary Survey reports an average of $38.24 an hour for drafting technologists and technicians in that province, about $76,000 a year. Québec’s occupational profile shows a median of $31.00 an hour for the same group, based on averages from 2023 to 2025. When three different data sources agree, I stop worrying about the details.
For a province-by-province comparison across all the job families, read CAD Salaries by Province: Ontario, Québec, BC, Alberta and More Compared.
What Actually Moves Your Pay Inside the Range
Now we get to the part that matters most. This section is experience, not data, but it is the experience of someone who has been on the other side of the table many times.
1. Scope of responsibility, not years alone
Time in the profession matters, but what employers pay for is what you can be trusted with. A drafter who can only produce drawings from marked-up sketches lives in the lower half of the range. A drafter who can read the engineer’s intent, spot a conflict between disciplines, check someone else’s work and answer the client’s questions lives in the upper half. I have seen two people with ten years of experience separated by $15,000 a year for exactly this reason.
2. Discipline and sector
Specialties with more engineering content or more regulatory pressure usually sit higher: civil, mechanical design and geomatics above general drafting. Sectors with large capital budgets, such as energy, utilities and large infrastructure, tend to compete harder for people than small residential practices. I cannot give you a verified number for each sector, because there is no national wage table by industry for these roles. Treat this as a direction, not a statistic.
3. Region
As the provincial table shows, a difference of $9 an hour between provinces is normal. Moving can be the biggest “raise” you ever negotiate, but only if the cost of living and your family situation allow it.
4. Credentials that employers recognize
A diploma in engineering design technology or architectural technology is the baseline. Professional designations offered by provincial technologist associations (such as C.Tech., C.E.T. and AScT) can open doors to senior roles and to work that requires a certified signature. Software certifications show skill but rarely change pay on their own. I explain which ones are worth the effort in Which CAD, BIM and GIS Certifications Actually Help You Get Hired? and Technologist Certification in Canada: C.Tech., C.E.T., AScT and Provincial Associations Explained.
5. Skills that cross boundaries
The people I paid best at the end of my management career were rarely the fastest at any single task. They were the ones who combined two or more things: CAD with BIM coordination, Civil 3D with GIS, SolidWorks with simulation, drafting with automation. If you want to know which combinations are most requested right now, see Which CAD Skills, Software and Certifications Pay More in Canada?
6. Employer type
Large consulting firms have formal salary bands, structured reviews and training budgets. Small firms can move fast, give you more responsibility early and pay in other ways. Public employers (municipalities, provinces, utilities) usually pay slightly less on base salary but compensate with pensions, benefits and stability. None of these is better in the abstract. What matters is which one fits your life stage.
7. How offers are really built
Inside a firm, most roles have a salary band with a minimum, a midpoint and a maximum. New hires typically enter below the midpoint, because the employer wants room for raises. If you ask for the midpoint with a strong case, you will often get close to it. If you ask for the maximum on day one, you are asking the manager to break their own system, and they will usually say no. The strongest negotiation is not “I want more”, it is “here is the range for this occupation, and here is where my experience puts me in it.” I give you scripts for this in How to Negotiate a CAD Salary or Raise in Canada: Data, Scripts and Strategy.
Total Compensation: The Hourly Wage Is Only Part of the Story
When you compare two offers, compare the whole package, not just the number on top.
Job Bank reports the share of workers who receive at least one non-wage benefit: 93.7% for drafting technologists and technicians, 86.7% for architectural technologists, 90.7% for civil engineering technologists and 91.7% for geomatics technicians and analysts. Benefits, according to Job Bank, can include employer-sponsored pension plans, dental, medical and life insurance, leave entitlements, paid sick and vacation days and employer contributions to public pension and insurance programs.
In real negotiations I also look at:
- Overtime rules. Paid, banked as time off, or “expected” and unpaid? In a busy design office this can be worth 5% to 10% of annual income either way.
- Professional fees. Does the employer pay your association dues and your exam fees?
- Training and software. Is there a budget for courses, certifications and conferences?
- Flexibility. Hybrid work, compressed weeks and travel expectations have a real monetary value.
- Pension and RRSP matching. Free money you only get if you stay.
I walk through this with a checklist in How to Evaluate a CAD Job Offer: Salary, Benefits, Overtime and Total Compensation.
Market Outlook: How Many Jobs, and Where
Salary and demand are linked. Two public sources help:
- British Columbia. WorkBC forecasts about 1,650 job openings between 2025 and 2035 for drafting technologists and technicians in the province, and 740 openings for architectural technologists.
- Québec. The government’s occupational profile counts about 9,000 jobs in drafting technologists and technicians in 2024.
Job Bank’s own prospect rating for these occupations varies by region, which tells you what every hiring manager already knows: the market is local. A strong portfolio in Calgary and the same portfolio in Halifax lead to different conversations. For the hiring side of the market, I will keep State of CAD, BIM and GIS Hiring in Canada updated as new data appears.
What the Data Cannot Tell You
A good guide should be honest about its limits. These are the main ones.
- No experience adjustment. Job Bank does not break wages down by years of experience. I use Alberta’s survey, which does report starting, overall and top wages for some groups, to give you an idea of progression in CAD Drafter Salary in Canada (2026): By Province, Experience and Industry.
- No software breakdown. There is no official dataset that says what an AutoCAD user earns compared with a Revit or SolidWorks user. Anyone who gives you a precise software premium is guessing.
- BIM is hidden. Because BIM titles sit inside broader codes, the wage data for them is thinner and older than for other groups.
- Small samples. For small provinces and territories, figures can be missing (“n/a”) or rely on statistical models.
- A two-year lag. The figures describe 2023–2024. The market has moved since, in different directions for different regions.
- Salary aggregator websites. I treat them as hints at best. Their numbers come from user submissions and modelling, and they often mix hourly and annual values or different currencies. If a site disagrees sharply with Job Bank, Job Bank is almost always the better starting point.
Build Your Own Number in 20 Minutes
Here is the method I teach to people before a salary conversation.
- Find your occupation group. Drafter or CAD technician: NOC 22212. Architectural: 22210. Civil: 22300. Mechanical design: 22301. GIS: 22214.
- Find your province and write down the low, median and high from the tables above (or from Job Bank directly).
- Collect 5 to 10 recent job postings for similar roles in your area. In provinces with pay transparency, note the ranges.
- Place yourself in the range. Be honest: independent work on complex projects, ability to check others’ work, specialty skills and client contact all push you up.
- Add the non-salary parts. Benefits, overtime, flexibility, training.
- Set three numbers: your target, your realistic minimum and your walk-away point.
Example. A drafter in Ontario with five years of experience and good Civil 3D skills checks the table. The provincial median is $31.25 an hour, which is $65,000 a year at 2,080 hours. The postings she finds for similar jobs mention ranges above that median. Her target will not be the median, because her skills put her above the middle. She will build her number from the evidence, not from a feeling.
If you prefer to do this with a tool, the CAD Salary Calculator by Role and Province will do the arithmetic for you.
Frequently Asked Questions
What is the average salary of a CAD drafter in Canada? Job Bank publishes medians rather than averages. The national median for drafting technologists and technicians is $31.79 an hour, about $66,100 a year at 2,080 hours. Alberta’s survey, which reports averages, shows $38.24 an hour for the same group in that province.
Do BIM jobs pay more than CAD jobs? It depends on the role. Job Bank’s figure for BIM specialists is similar to that of drafters. What pays more is the responsibility that tends to come with BIM: coordination, standards and leadership. See BIM Coordinator, Modeler and Manager Salaries in Canada.
Which province pays the most? For drafting technologists and technicians, Alberta, Newfoundland and Labrador and Saskatchewan lead. For GIS analysts, Alberta is at the top among the provinces.
Is a diploma enough, or do I need a degree? For most drafting, CAD and BIM technician roles, a college diploma is the norm. A degree opens engineering roles, which pay more but are a different career. Read From Technologist to Engineer: Pathways, Bridging Programs and Trade-Offs in Canada before you decide.
Do I get paid overtime? It depends on the employer and the province’s labour standards. Always ask how overtime is handled before you accept.
How often should I check my salary against the market? Once a year is enough. The best time is just after Job Bank publishes its new wages in the fall, and before your annual review.
Sources and How to Verify Them
Every number in this guide can be checked. These are the main sources:
- Job Bank: Design and drafting technologist wages (NOC 22212)
- Job Bank: Architectural technologist wages (NOC 22210)
- Job Bank: Civil engineering technologist wages (NOC 22300)
- Job Bank: Mechanical engineering design technologist wages (NOC 22301)
- Job Bank: Geographic information systems (GIS) analyst wages (NOC 22214)
- Job Bank: how wages are determined (methodology)
- Alberta ALIS: Drafting technologists and technicians wages
- WorkBC career profile: Drafting technologists and technicians
- Québec occupational profile: Drafting technologists and technicians
Job Bank figures for BIM specialists come from the release published on December 3, 2024. Wage tables for the other groups come from the November 19, 2025 release. Live pages may already show newer figures.
Where to Go Next
If you are building a career, start with How to Become a CAD Drafter in Canada: Step-by-Step Roadmap. If you are looking for work, read How to Find CAD Jobs in Canada: The Complete 2026 Guide and How to Get Your First CAD Job in Canada: Entry-Level Roadmap. And if you are on the other side of the table, I wrote CAD Salary Benchmarks for Employers (2026) for you.
The market rewards people who understand it. Now you do.