

For several years I managed a CAD department that produced utility drawings for municipalities and a separate team, two floors up, that managed the same utilities in a GIS. For months nobody noticed that the pipe diameters in our drawings and the pipe diameters in their database came from two different spreadsheets. When the mismatch finally surfaced, it took three people almost a month to reconcile it. That experience changed how I think about our profession. CAD, BIM and GIS are not three careers. They are three views of the same physical world, and the people who can move between them are the ones every employer struggles to find.
That is also why GIS pay deserves a place in a guide written for CAD and BIM professionals. If you are a drafter, a designer or a coordinator, GIS may be your most valuable second skill. If you are already a GIS technician or analyst, you want to know whether the market is paying you fairly.
The short version is encouraging: in the official data, GIS analysts have the highest national median of any group I cover in this category. The long version, which is what this guide gives you, explains why, where, and what it takes to get there.
The Short Answer
Job Bank publishes wages for the job title geographic information systems (GIS) analyst, in the occupation group technical occupations in geomatics and meteorology (NOC 22214):
- Low (10th percentile): $23.08 an hour, about $48,000 a year
- Median: $38.10 an hour, about $79,200 a year
- High (90th percentile): $53.85 an hour, about $112,000 a year
These figures come from the Job Bank release updated on November 19, 2025 and reflect wages paid in 2023–2024. Annual values assume 2,080 hours and are rounded to the nearest $100. For how to read Job Bank’s wage data and its limits, see CAD, BIM and Drafting Salaries in Canada: The Complete 2026 Data Guide.
GIS technicians do not have a separate national wage line in the sources I could verify. In practice, technician-level work sits in the lower half of the GIS range, and analyst-level work sits at or above the median. I explain how I reason about that below.
GIS Technician or GIS Analyst: What Is the Difference?
The titles are used loosely, and employers mix them. Here is how I distinguish them after years of working beside both.
| GIS technician | GIS analyst | |
|---|---|---|
| Core work | Data capture, editing, quality control, mapping, cartography, updating layers | Spatial analysis, modelling, data integration, reporting, process automation |
| Typical tools | ArcGIS Pro, QGIS, desktop editing, standard workflows | The same, plus Python, SQL, FME or similar data tools, web mapping |
| Decisions | Follows standards and procedures | Designs the method and interprets the result |
| Typical education | College diploma or certificate in GIS or geomatics | Diploma, degree or postgraduate certificate in GIS, geography or related field |
| Where it sits in the pay range | Lower to middle | Middle to upper |
| Next step | Analyst, senior technician | Senior analyst, GIS developer, coordinator, manager |
This is my practical summary, not a government classification. Job Bank groups both under the same occupational family, so when you check the tables below, place yourself by what you actually do.
GIS Analyst Salaries by Province and Territory
| Province or territory | Low (10th pct) | Median | High (90th pct) | Median per year |
|---|---|---|---|---|
| Canada | $23.08 | $38.10 | $53.85 | $79,200 |
| Northwest Territories (est.) | $30.55 | $49.98 | $61.17 | $104,000 |
| Yukon (est.) | $32.77 | $44.46 | $53.01 | $92,500 |
| Alberta | $37.41 | $42.56 | $60.00 | $88,500 |
| Nunavut (est.) | $23.89 | $41.10 | $53.79 | $85,500 |
| Québec | $23.70 | $38.00 | $48.08 | $79,000 |
| British Columbia (est.) | $26.05 | $37.79 | $51.83 | $78,600 |
| Saskatchewan | $20.50 | $37.66 | $47.80 | $78,300 |
| Manitoba | $31.25 | $37.28 | $55.96 | $77,500 |
| Ontario | $20.00 | $35.00 | $47.69 | $72,800 |
| Nova Scotia (est.) | $22.41 | $34.55 | $48.67 | $71,900 |
| Newfoundland and Labrador | $18.00 | $33.33 | $41.03 | $69,300 |
| New Brunswick (est.) | $22.46 | $33.12 | $46.22 | $68,900 |
(est.) marks figures that come from Statistics Canada’s model-based Small Area Estimation instead of a direct survey count. Annual figures: median × 2,080 hours, rounded to the nearest $100.
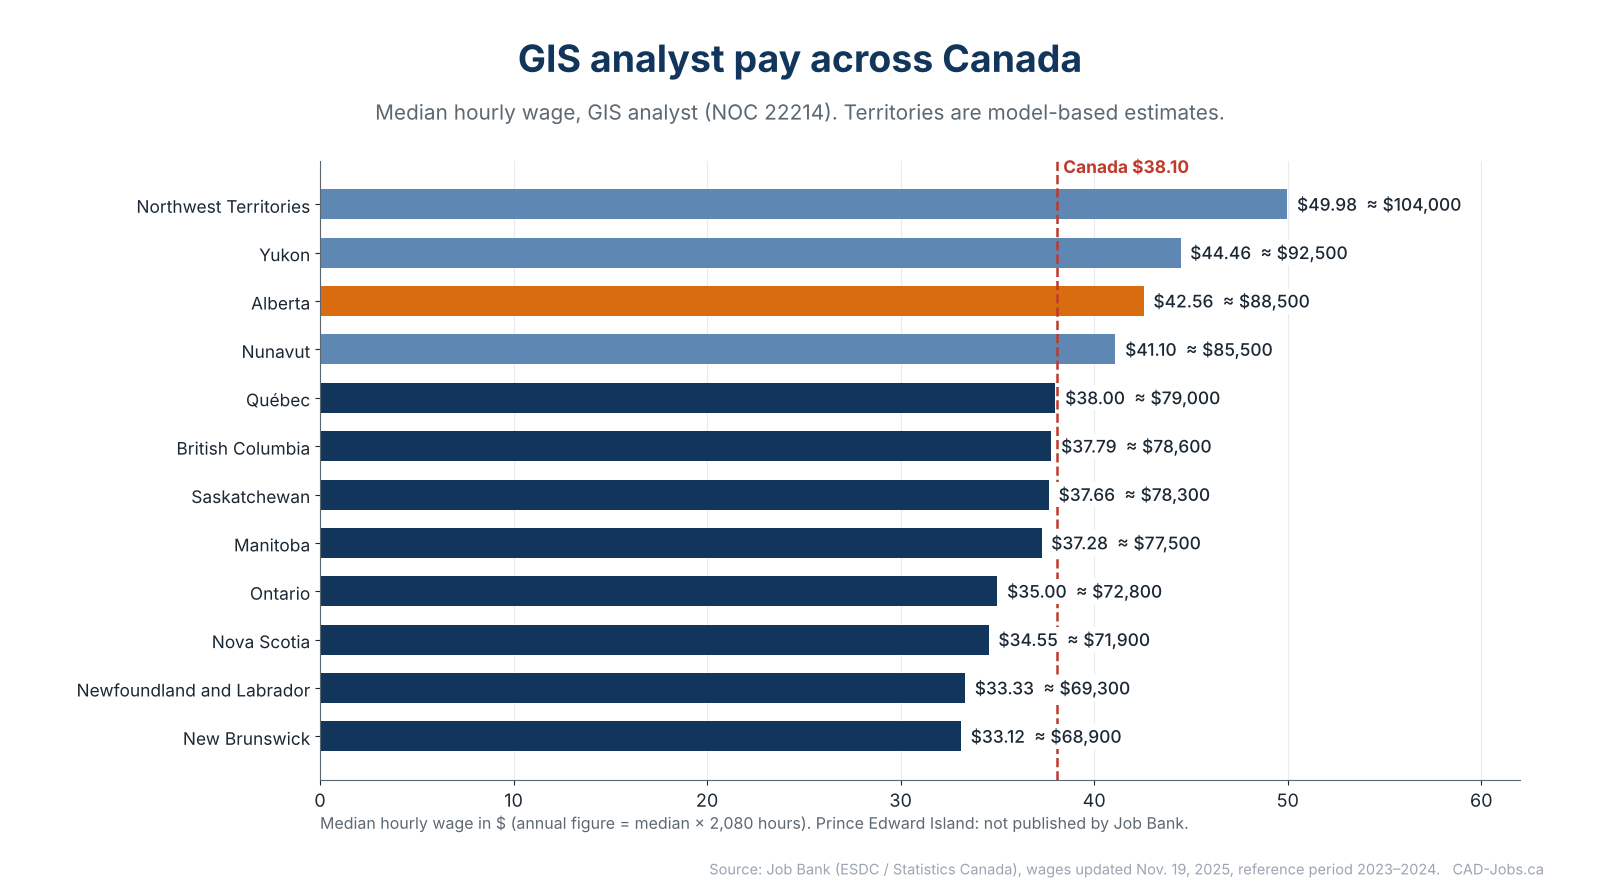
How I read this table:
- Alberta ($42.56) is the highest province. Its 10th percentile ($37.41) is even higher than the national median for many other groups. Energy, resource management, environmental work and a large provincial and municipal GIS community all play a role.
- Québec ($38.00), British Columbia ($37.79), Saskatchewan ($37.66) and Manitoba ($37.28) cluster around the national median of $38.10.
- Ontario ($35.00) sits below the national figure. It has the largest number of GIS professionals and the most competition.
- Nova Scotia ($34.55), Newfoundland and Labrador ($33.33) and New Brunswick ($33.12) are the lowest published provincial medians.
- The territories pay the most in absolute terms, with the Northwest Territories at $49.98, Yukon at $44.46 and Nunavut at $41.10. These are model-based estimates for very small labour markets and they reflect the high cost of living and recruitment in the North. They are not a number you should expect to find in a southern city.
- Prince Edward Island is not published for this occupation.
Where the figures come from. Alberta, Manitoba, Newfoundland and Labrador, Ontario, Québec and Saskatchewan figures come from Statistics Canada’s Labour Force Survey (2023–2024). British Columbia, New Brunswick, Nova Scotia and the territories come from Small Area Estimation (2024), a statistical model for places where the survey sample is too small.
Regional detail for places where Job Bank publishes it:
| Region | Province | Low (10th pct) | Median | High (90th pct) | Median per year |
|---|---|---|---|---|---|
| Wood Buffalo–Cold Lake | AB | $31.81 | $43.78 | $61.87 | $91,100 |
| Thompson–Okanagan | BC | $28.29 | $39.44 | $51.56 | $82,000 |
| Lower Mainland–Southwest | BC | $27.82 | $39.27 | $51.46 | $81,700 |
| Vancouver Island and Coast | BC | $27.44 | $38.63 | $47.54 | $80,400 |
Regional figures come from Job Bank, and several of them are model-based estimates. Annual figures: median × 2,080 hours, rounded to the nearest $100.
The Wood Buffalo–Cold Lake Region ($43.78), which includes Fort McMurray, shows what the resource economy can do to GIS pay. In British Columbia, the Thompson–Okanagan ($39.44), Lower Mainland–Southwest ($39.27) and Vancouver Island and Coast ($38.63) regions are all above the BC median of $37.79.
GIS vs CAD, BIM and Drafting: The Comparison That Matters
If you work in CAD or BIM and are thinking about GIS, here is how the national medians compare across the families I cover.
| Job family | National median | Median per year | Difference from drafting median |
|---|---|---|---|
| GIS analysts (NOC 22214) | $38.10 | $79,200 | +$6.31 an hour |
| Mechanical engineering design technologists (NOC 22301) | $35.00 | $72,800 | +$3.21 an hour |
| Civil engineering technologists (NOC 22300) | $33.89 | $70,500 | +$2.10 an hour |
| Drafting technologists and technicians (NOC 22212) | $31.79 | $66,100 | — |
| Architectural technologists (NOC 22210) | $30.10 | $62,600 | −$1.69 an hour |
GIS analysts earn about $6.31 an hour more than drafting technologists and technicians at the median, roughly $13,100 a year. That is a substantial gap, and I want to be careful about how I interpret it.
It is not a pure “GIS is better paid” signal. GIS analyst roles often require a stronger analytical and technical profile than entry-level drafting: spatial statistics, database skills, scripting and sometimes a university degree. The people in the group are not interchangeable with drafters. What the table does tell you is that the market pays well for people who can combine spatial thinking with data and programming skills, and that those skills are scarce.
For the other side of the comparison, see CAD Drafter Salary in Canada (2026): By Province, Experience and Industry and BIM Coordinator, Modeler and Manager Salaries in Canada.
What Drives GIS Pay
1. Analysis and automation beat production
A technician who edits and maps works within a process. An analyst who designs the process, automates it and explains the result changes the organization. In my experience, a person who can write a Python script that replaces three days of manual work every month is paid very differently from a person who cannot.
2. Data skills
SQL, spatial databases such as PostGIS, data integration tools such as FME and an understanding of data quality and coordinate systems separate analysts from technicians faster than any certificate.
3. Domain knowledge
GIS in utilities, water and wastewater, forestry, mining, environmental assessment, transportation or emergency management each has its own language. Knowing the domain makes your analysis relevant, and relevance is what employers pay for.
4. Employer type
- Municipalities and regional governments employ a large share of GIS professionals. Base pay follows public scales; pensions and benefits are strong.
- Provincial and federal governments offer stability, structured progression and specialized roles.
- Utilities and energy companies typically pay well and value GIS linked to asset management.
- Environmental and engineering consultancies pay in line with their billing structures, with more variety and faster growth for strong performers.
- Technology and data companies pay the most for developers and data specialists, but they are a different part of the market.
5. Geography
As the table shows, the same job title differs by more than $9 an hour between Alberta and New Brunswick. In the North, premiums reflect the cost and difficulty of recruiting.
6. Leadership
GIS coordinators and managers who run teams, budgets and enterprise systems move beyond the analyst range. Public data on these roles is thin, so treat them as a separate negotiation.
Skills and Credentials That Support a GIS Salary
I cannot give you a dollar value for each credential, since there is no official data that isolates it. This is where each one helps.
- A college diploma or postgraduate certificate in GIS, or a degree in geography or a related field. The baseline for most analyst roles.
- Esri technical certifications show competence on the dominant commercial platform, ArcGIS, and are often valued by employers that use it.
- GISP (GIS Professional), a professional certification offered by the GIS Certification Institute, recognizes education, experience and contributions to the profession.
- Python, SQL and data engineering skills. For many employers, these are the real differentiators.
- Open-source GIS (QGIS, PostGIS) is increasingly relevant, especially in the public sector and in smaller organizations.
- Web mapping and dashboards for communicating results to non-specialists.
- Remote sensing and imagery analysis for environmental, forestry and resource roles.
- A technologist designation where your province offers one and your employer values it. See Technologist Certification in Canada: C.Tech., C.E.T., AScT and Provincial Associations Explained.
For the broader picture across CAD, BIM and GIS, read Which CAD, BIM and GIS Certifications Actually Help You Get Hired?
For CAD and BIM Professionals: Crossing Into GIS
If you come from drafting, design or BIM coordination, you have more of the GIS skill set than you think. You understand scale, coordinates, layers, attributes, data standards and the discipline of keeping drawings consistent. The gaps are usually data modelling, databases and spatial analysis.
Here is the six-month plan I give people who want to make the move.
Month 1: Understand the world you are entering. Learn how coordinate systems and projections work and why a drawing in a local grid is not automatically a map. This is the single biggest conceptual jump.
Months 2 and 3: Learn one desktop platform well. ArcGIS Pro or QGIS, with a focus on data editing, symbology, layout and geoprocessing. If your firm uses Autodesk, explore how Civil 3D and AutoCAD Map 3D exchange data with GIS.
Month 4: Add SQL. Basic queries, joins and attribute management. It pays back immediately.
Month 5: Add Python. Start with small scripts that automate a repetitive task you already do.
Month 6: Build a project for your portfolio. Take a real drawing set, convert it, clean it, load it into a GIS and publish a simple web map. Document the process.
The role where I have seen this combination pay off best is the bridge between design and asset management: people who can take a design package and turn it into reliable GIS data for the owner. That role did not exist when I started, and it is in demand now.
For the career side of this move, see How to Become a GIS Technician or GIS Analyst in Canada and CAD, BIM and GIS Careers in Canada: Roles, Paths, Pay and Outlook.
Benefits and the Rest of the Package
Job Bank reports that 91.7% of workers in this occupation group in Canada receive at least one non-wage benefit (86.3% in British Columbia). These can include employer pension plans, dental, medical and life insurance, paid vacation and sick days, and employer contributions to public pension and insurance programs. In the public sector, the pension and benefits package can add up to a large share of total compensation. In my experience, many GIS professionals take a modest base-salary difference in exchange for stability and a pension.
Compare offers with a checklist, not just a salary number: How to Evaluate a CAD Job Offer: Salary, Benefits, Overtime and Total Compensation.
How to Negotiate a GIS Salary
- Pick the right row. Use your province’s GIS analyst median, and be honest about whether your job is technician or analyst level.
- Show what you automate. Hours saved, errors prevented, data quality improved.
- Show impact. Decisions that rely on your analysis, projects that depend on your data.
- Check the scope. Will you own the database, the standards, the web maps? Scope drives pay.
- Compare against posted ranges. In provinces with pay transparency rules (British Columbia, Prince Edward Island, Ontario and New Brunswick as of autumn 2026), many postings show ranges you can compare with the Job Bank median.
For scripts and strategy, read How to Negotiate a CAD Salary or Raise in Canada: Data, Scripts and Strategy.
Frequently Asked Questions
How much does a GIS analyst make in Canada? Job Bank’s national median is $38.10 an hour, about $79,200 a year at 2,080 hours. The middle 80% earn between $23.08 and $53.85 an hour.
How much does a GIS technician make? There is no separate national wage line in the sources I could verify. Technician-level work usually sits in the lower half of the analyst range, depending on province, employer and tools.
Which province pays GIS analysts the most? Among the provinces, Alberta, at $42.56 an hour. The territories show higher figures, based on model estimates for small markets.
Do GIS analysts earn more than CAD drafters? At the national median, yes: $38.10 versus $31.79 an hour. The roles differ in education, skills and responsibilities, so the comparison is a market signal, not a promise.
Is GIS a good second skill for a CAD or BIM professional? In my experience, it is one of the best, especially for people working with utilities, infrastructure, municipalities or asset management.
Do I need a degree to work in GIS? Many technician roles accept a college diploma or certificate. Many analyst and developer roles ask for a degree or a postgraduate certificate, plus demonstrated technical skills.
Sources
- Job Bank: Geographic information systems (GIS) analyst wages (NOC 22214)
- Job Bank: Design and drafting technologist wages (NOC 22212)
- Job Bank: Civil engineering technologist wages (NOC 22300)
- Job Bank: Mechanical engineering design technologist wages (NOC 22301)
- Job Bank: How wages are determined
Wages describe 2023–2024. Figures marked as model-based estimates come from Statistics Canada’s Small Area Estimation. Check the live Job Bank pages for newer releases.
The people who earn the most in our profession are rarely the ones who know the most about one tool. They are the ones who can connect the drawing, the model and the map, and explain what the connection means. Learn to do that, and the data in this guide will describe your floor, not your ceiling.